BTC and ETH Weekly Analysis (22 Oct 2026): ETF Inflows and the $84K Level
BTC rose 3.2% and ETH 2.5% this week, but the driver was roughly $550 million of net inflows into spot bitcoin ETFs over two sessions, not a new narra…
BTC and ETH both closed higher this week (16–22 October), but the move looks more like ETF money pushing the market than a new narrative taking hold. As of 10:00 UTC+8 on 22 October, BTC traded near $84,100, up 3.2% over seven days, while ETH traded near $2,472, up 2.5%. US spot bitcoin ETFs took in roughly $550 million over two sessions, largely reversing the outflows seen in early October.
This is not a price-target call. It separates the week’s price structure, flows and external variables, and leaves four indicators you can track next week.
Scorecard: higher, but still inside the range
| Metric | BTC | ETH |
|---|---|---|
| Price (22 Oct, 10:00) | ~$84,100 | ~$2,472 |
| 7-day change | +3.2% | +2.5% |
| 24-hour change | +1.3% | +0.9% |
| 7-day range | 79,800 – 84,898 | 2,318 – 2,527 |
| Market cap | ~$1.69 trillion | ~$302 billion |
| Dominance | 57.9% | 10.4% |
Price structure: 79,800 was the real floor
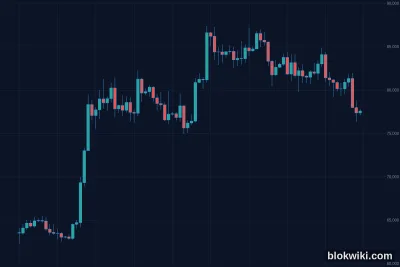
BTC fell first and rallied later. On 15 October it sold off on heavy volume to 79,800; daily volume of about 22,600 BTC was the highest in two weeks, a classic capitulation print. Price then refused to break lower and spent four days ranging between 80,700 and 82,300. On 20–21 October it closed above 83,000 twice and pushed to 84,898 on the 21st, with volume back at 16,550 BTC — enough to confirm the rebound was not a single tick.
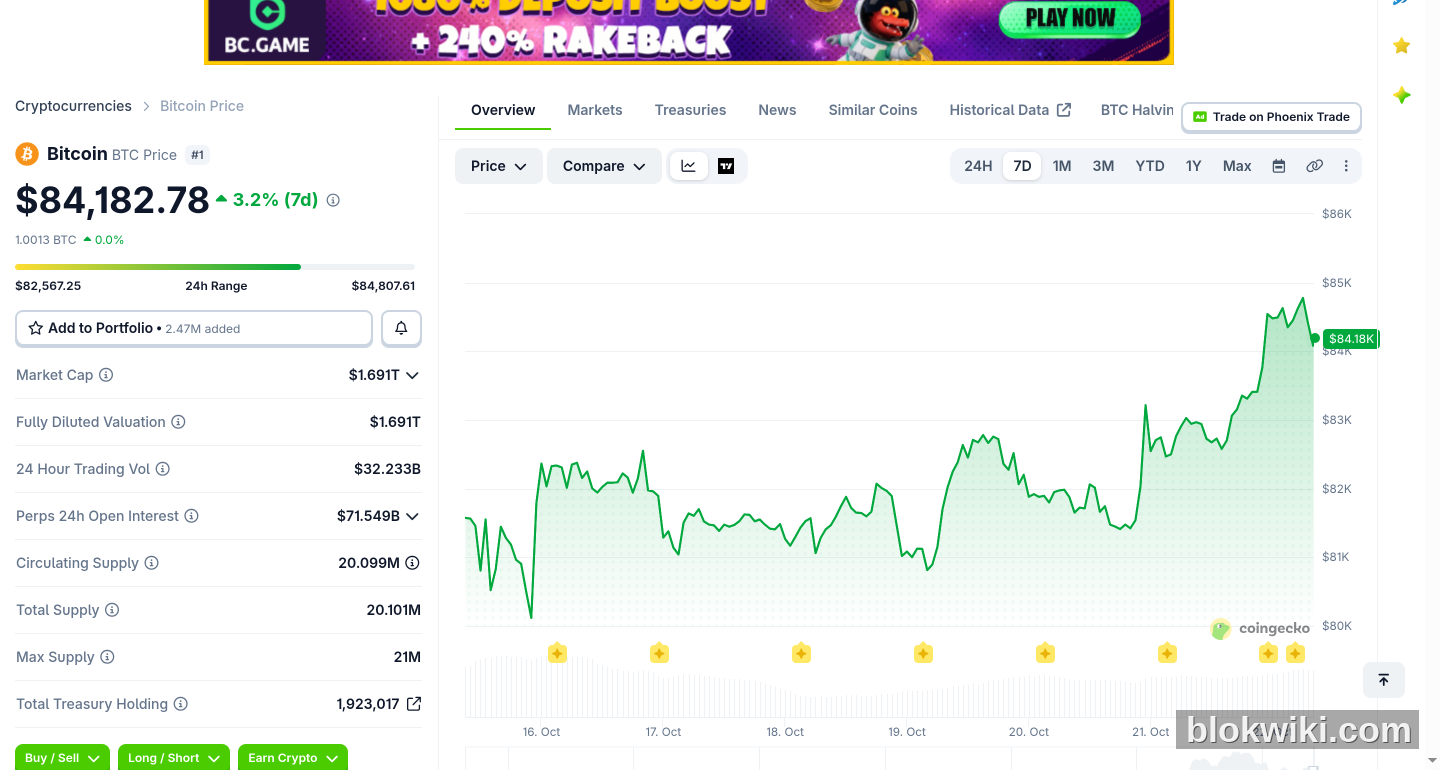
The levels are therefore clear. On the upside, 84,900–85,000 is where the weekly high meets the round number; only a daily close above 85,000 opens the next leg. On the downside, 82,600 is the congestion area before the 21st breakout, with 81,200 behind it; 79,800 is the invalidation level for this ETF-driven repair.
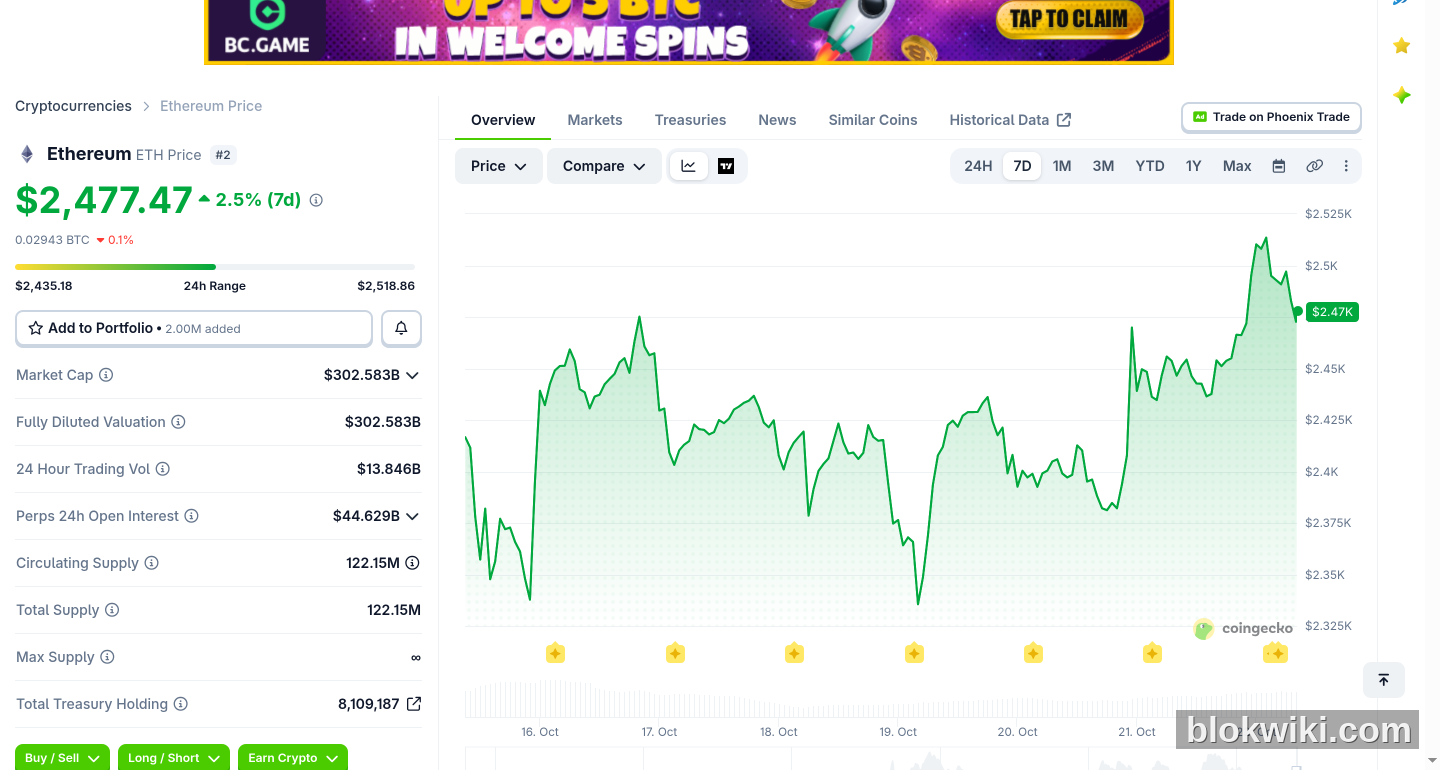
ETH is structurally weaker. It bottomed at 2,318 on 15 October, peaked at 2,527 on the 21st and now trades at 2,472, about 2% below the weekly high. More importantly, ETH/BTC has stayed near 0.0294, barely appreciating all week. That tells you money is buying “crypto as an asset class”, not “the Ethereum story”.
Flows: ETF inflows are the driver, not a new narrative
The clearest marginal buyer this week was the spot bitcoin ETF complex. Public SoSoValue data shows about $550 million of net inflows across 20–21 October, including roughly $527 million on the 21st alone, and about $2.3 billion over the past month, with BlackRock’s IBIT absorbing most of it.
That explains why BTC found a floor at 79,800: spot ETF buying is passive allocation, but it tends to cluster when price approaches institutional cost bases. It did not create a new use case; it partly refilled the money that left in early October. As a result, the rally is highly dependent on the daily flow print — two consecutive days of net outflows would quickly put 82,000 back in play.
ETH runs on a different funding logic. On-chain staking has risen to 43.8 million ETH, about 35.9% of supply and a record high (see our Ethereum staking feature). Locking supply reduces the float, but it does not create new demand. For ETH to genuinely outperform BTC, it needs ETF inflows or a recovery in on-chain demand, not just a smaller float.
Why this rebound can stall easily
- Flow-driven, not narrative-driven. ETF inflows can reverse quickly. This year has repeatedly seen several strong days followed by a sharp slowdown or a negative print, with price giving back the gains.
- BTC dominance is too high. At 57.9%, capital is still concentrated in BTC and altcoins are not broadly participating. Healthy rallies usually see dominance fall.
- ETH/BTC does not confirm. A flat 0.0294 means the market is not pricing an Ethereum recovery; ETH is simply following.
- Macro remains exogenous. Dollar liquidity, rate expectations and geopolitical events can change risk appetite overnight, and this week’s price action offers no buffer against them.
Next week’s watchlist: four indicators are enough
- Can BTC close a day above 84,900? If yes, 86,000–87,000 comes into view; two consecutive rejections favour a retest of 82,600.
- The 82,600 and 79,800 supports. 82,600 is the short-term bull/bear line; 79,800 is the invalidation level for this repair.
- Daily spot ETF net flows. Two consecutive negative days should lower your position expectations — do not fight the flow.
- ETH/BTC and BTC dominance. Only ETH/BTC above 0.0300 and dominance below 57% would confirm a real broadening of risk appetite; otherwise ETH remains a follower.
FAQ
Is this a bull or bear market?
The more accurate description is a flow-driven repair inside a range. BTC is still between 79,800 and 85,000, without a new high or a lower low. Bull/bear labels tend to obscure the fact that the flow direction has already changed.
Can BTC break 85,000 next week?
It depends on whether ETF inflows continue. Price has repeatedly stalled near 84,900, and a breakout needs new buying rather than existing capital churning. A long sideways move that fails to break often resolves lower.
Why is ETH underperforming BTC?
Staking locks supply without bringing in new capital, and a flat ETH/BTC means money is not rotating from BTC into ETH. Changing that requires sustained ETH ETF inflows or a recovery in on-chain demand.
What should ordinary users do now?
If you are a long-term holder, position sizing and custody matter more than next week’s level. If you trade short-term, use 82,600 and 79,800 as stop references rather than predicting direction. Treat exchanges as rails and move large balances to self-custody.
Market data changes; the method does not: flows first, price structure second, opinions last. To open an account for spot-market observation, use our Binance registration link. On-chain background is available on the Bitcoin coin page and the Ethereum coin page, and the exchange-level comparison is on our Binance exchange page.
Risk notice and affiliate disclosure: Crypto assets are highly volatile and you may lose all of your capital. This article is information and opinion, not investment advice. Prices, ETF flows and staking figures are public snapshots taken on 22 October 2026 and will change; rely on the current pages of exchanges and data providers. This article contains affiliate links; we may earn a commission if you register through them, at no extra cost to you, and it does not affect our conclusions.